About Facebook Page Insights Report
What's the role of Facebook in your Marketing Efforts
Facebook pages play a crucial role in modern marketing and social media strategy. They serve as a platform for businesses and individuals to engage with their audience, promote their products or services, and build brand awareness. With billions of users, Facebook offers an unparalleled opportunity to reach a vast and diverse audience.
How to monitor your Facebook Page Insights
To effectively leverage Facebook pages, it's essential to monitor and analyze their performance. However, monitoring the performance of your Facebook activity is not necessarily easy. Navigating the official Facebook metrics platform is not intuitive and often the automatic alternatives are expensive and hard to configure. That's why many people end up doing it manually, exporting data into different spreadsheets and analyzing it very inefficiently.
This Facebook Page Insights Report provide detailed metrics that help you understand how your audience interacts with your content. By analyzing these insights, you can make data-driven decisions to improve your social media strategy, enhance engagement, and achieve your marketing goals.
Automating Your Facebook Page Performance Monitoring
This template automates the process of monitoring your Facebook page performance, all in a spreadsheet.
Follow these steps to generate your performance report:
- Start by specifying the date range for which you want to retrieve posts.
- Input the username of your Facebook page.
- Rows built-in functions will automatically retrieve the main metrics for your pages and the posts, organizing them to provide the best insights on your audience behaviour, such as weekly engagement over time, post reactions by type and follower growth.
- You can customize your report by adding or changing the list of metrics to be retrieved.
By automating this process, you can save time, reduce errors, and ensure that you have access to accurate and comprehensive data to inform your social media strategy.
What's Included in this Facebook Page Insights Report
This comprehensive report includes various sections that provide detailed insights into your Facebook page performance:
Page Summary: This table offers an overview of your page's overall performance, including Total Reach, Total Impressions (both organic and paid), Total Post Engagements, Total Reactions, and Engagement Rate. These metrics help you understand the broad impact of your page on your audience.
Posts Overview: Here, you will find detailed information about your posts, such as Total Organic Impressions, Total Paid Impressions, Total Clicks, Total Engaged Users, and Engagement Rate. This overview allows you to evaluate how individual posts are performing and which types of content are most effective.
Weekly Engagement and Impressions: This section breaks down your page's engagement and impressions on a weekly basis, helping you identify trends and patterns over time.
Weekly Feedback Trend: This chart tracks positive, negative, and net feedback weekly, providing insights into audience sentiment and how it evolves.
Total Reactions by Type: Analyze the different types of reactions your posts receive (e.g., likes, loves, wows) to understand what kind of content resonates most with your audience.
Top 10 Posts by Engagement: Discover which of your posts have generated the highest engagement, allowing you to replicate successful strategies in future content.
Top 10 Most Viral Posts: Identify the posts that have gained the most viral traction, helping you understand what types of content are most likely to be shared.
Follower Growth Tracker: Monitor the growth of your page's followers over time to gauge your overall audience expansion efforts.
How it works
How it works
Get started
Click on 'Use template' and start using it right away. No forms, no signup. Your data first.
Connect your Facebook account
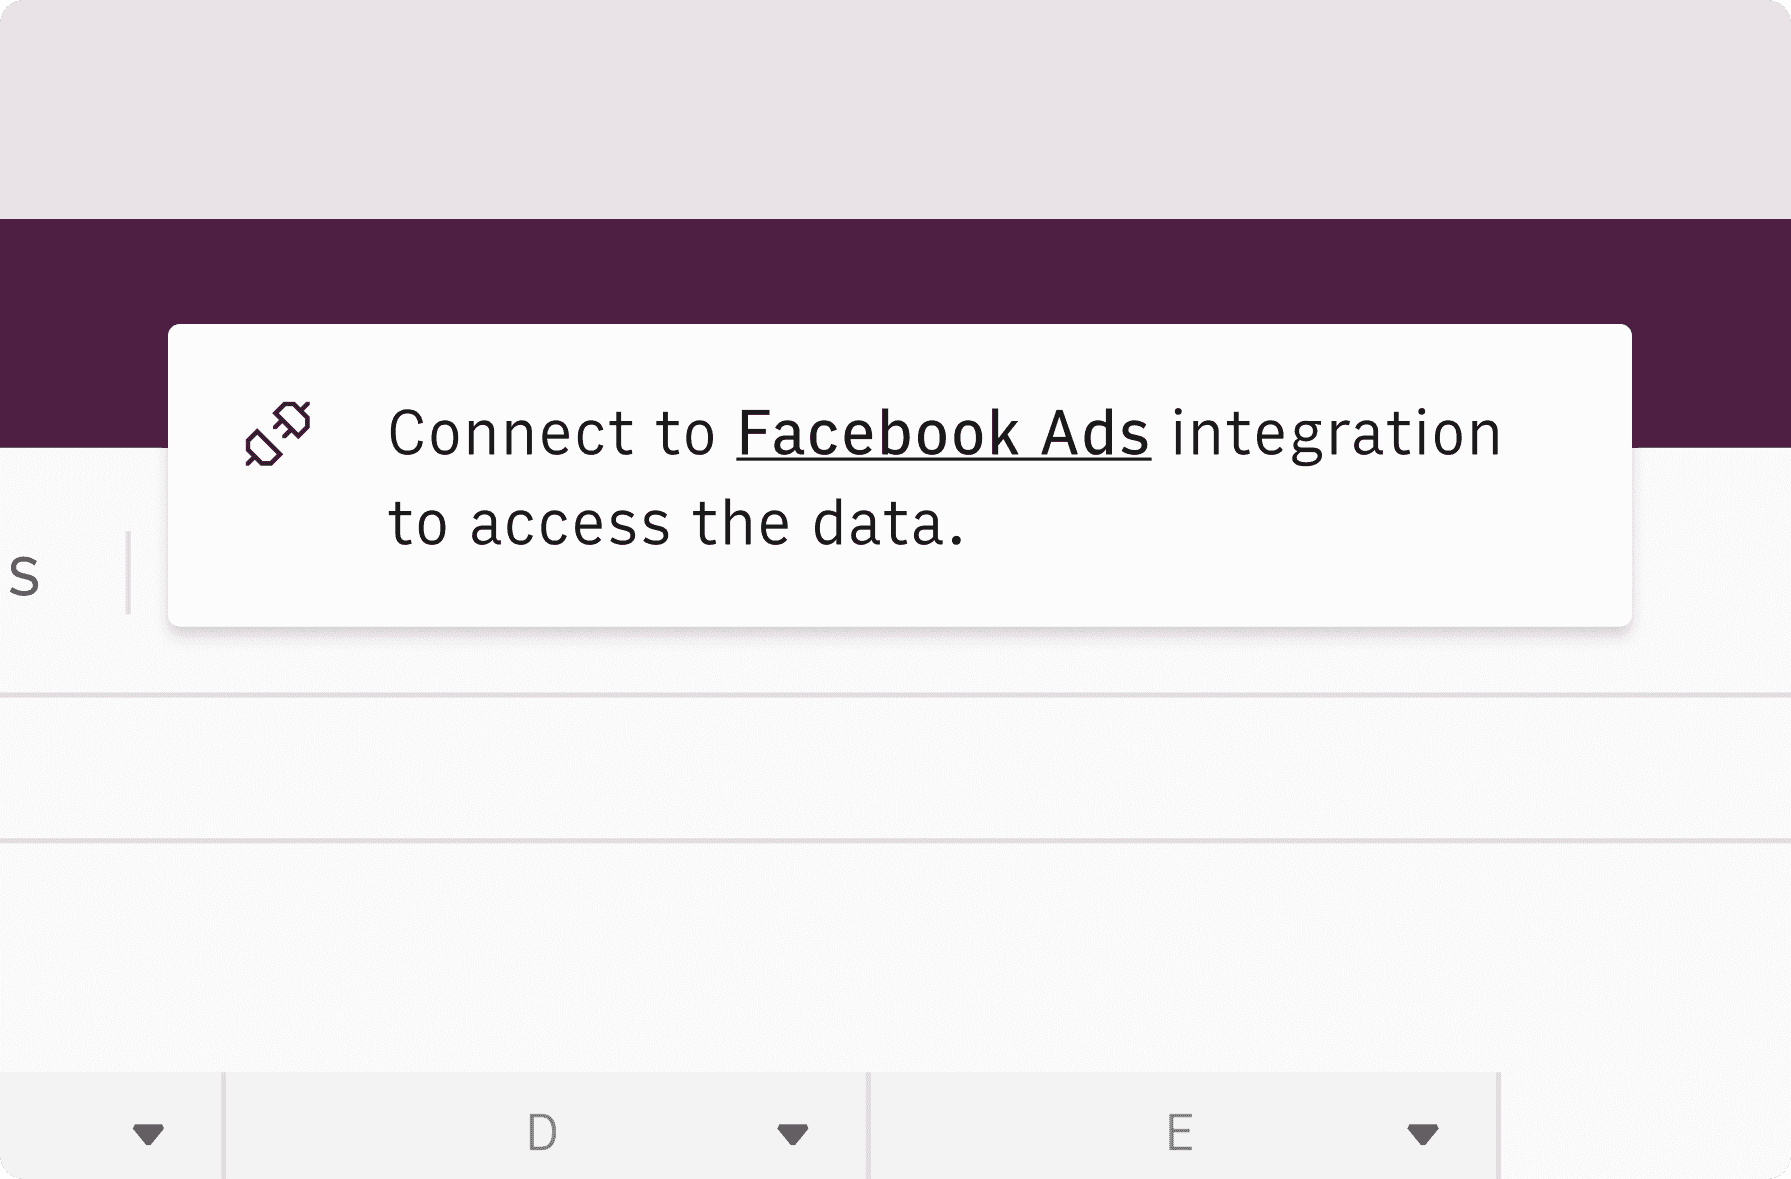
Once landed on the spreadsheet, follow the instructions to connect the required integration and pick your account.
Customize the template and schedule refresh
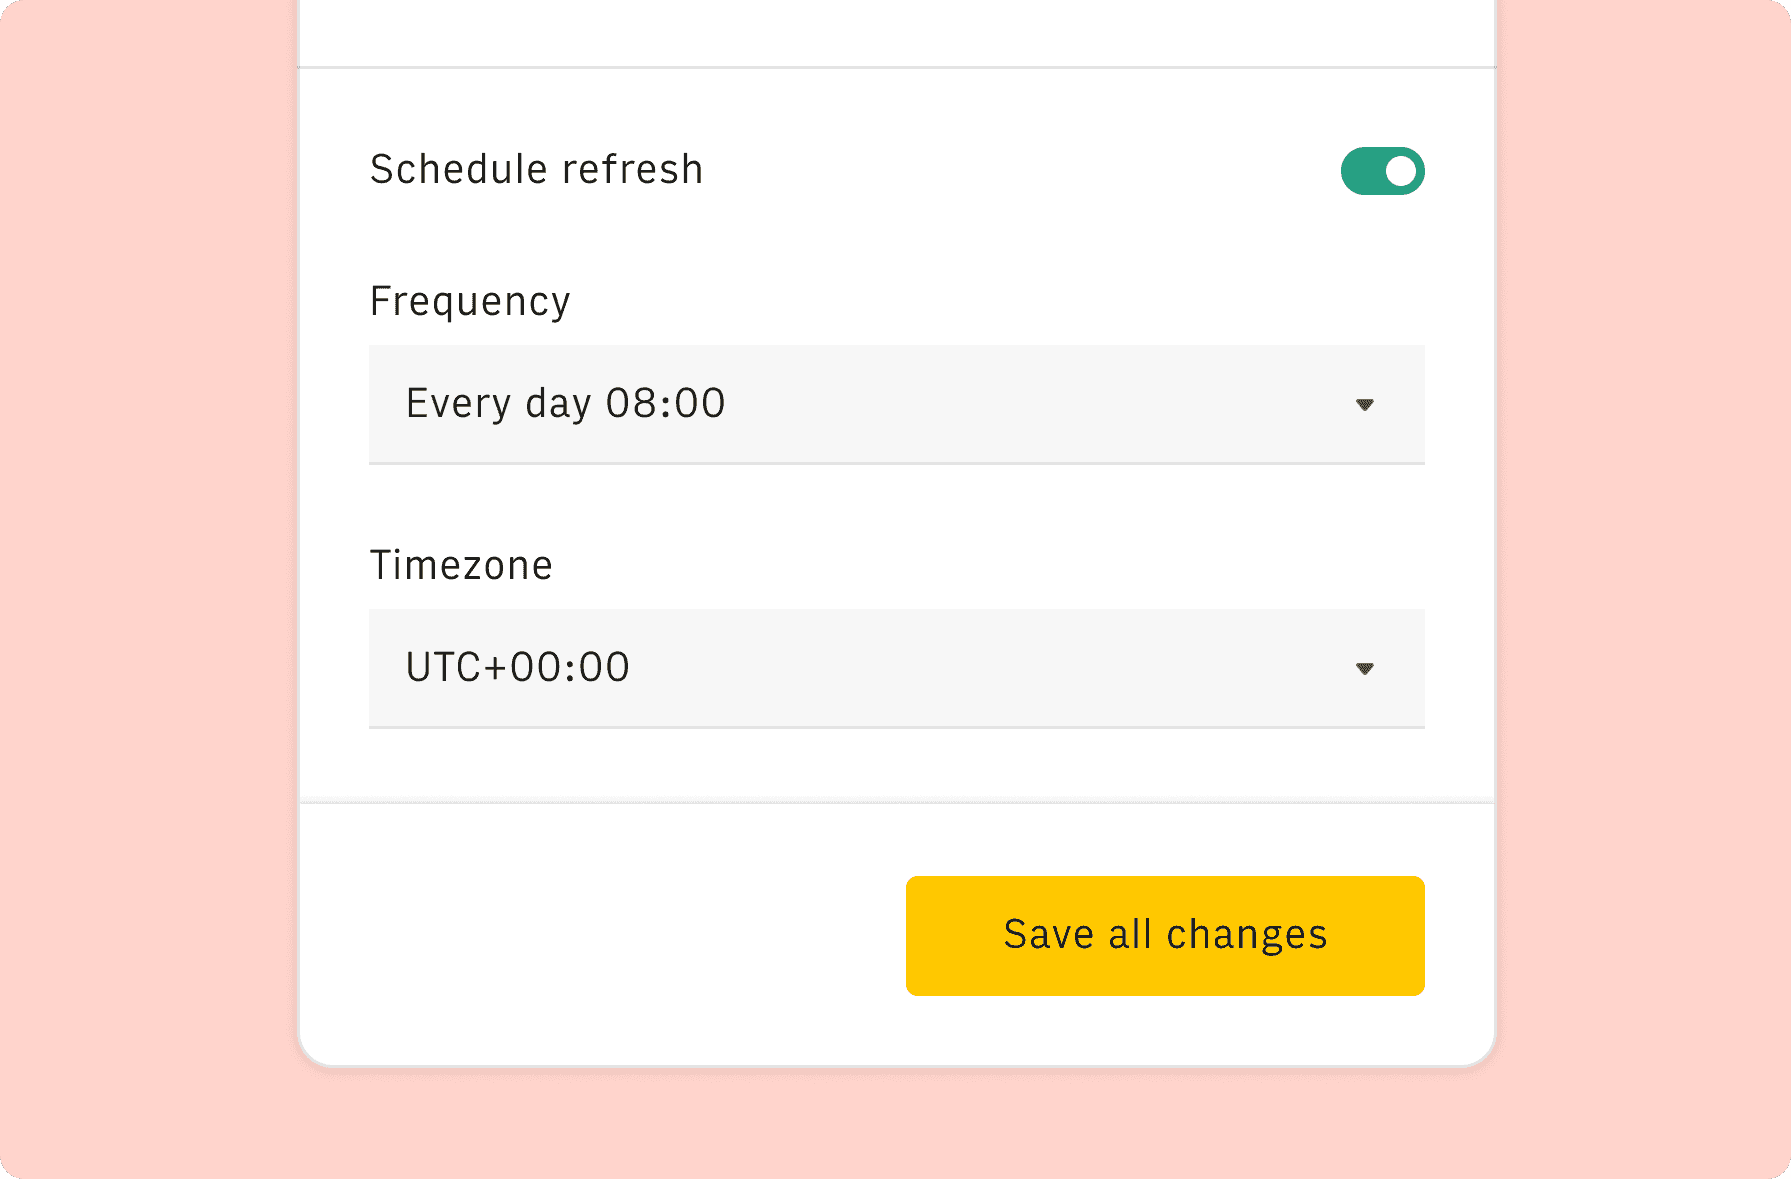
Once the integration has been connected, all tables will update automatically with your own data. Click on 'Edit Source' to change the retrieved data and automate the data refresh. You can then insert a chart or a pivot table, add a column or personalize formats, using all the regular functions and shortcuts that make spreadsheets great.
Embed tables and charts
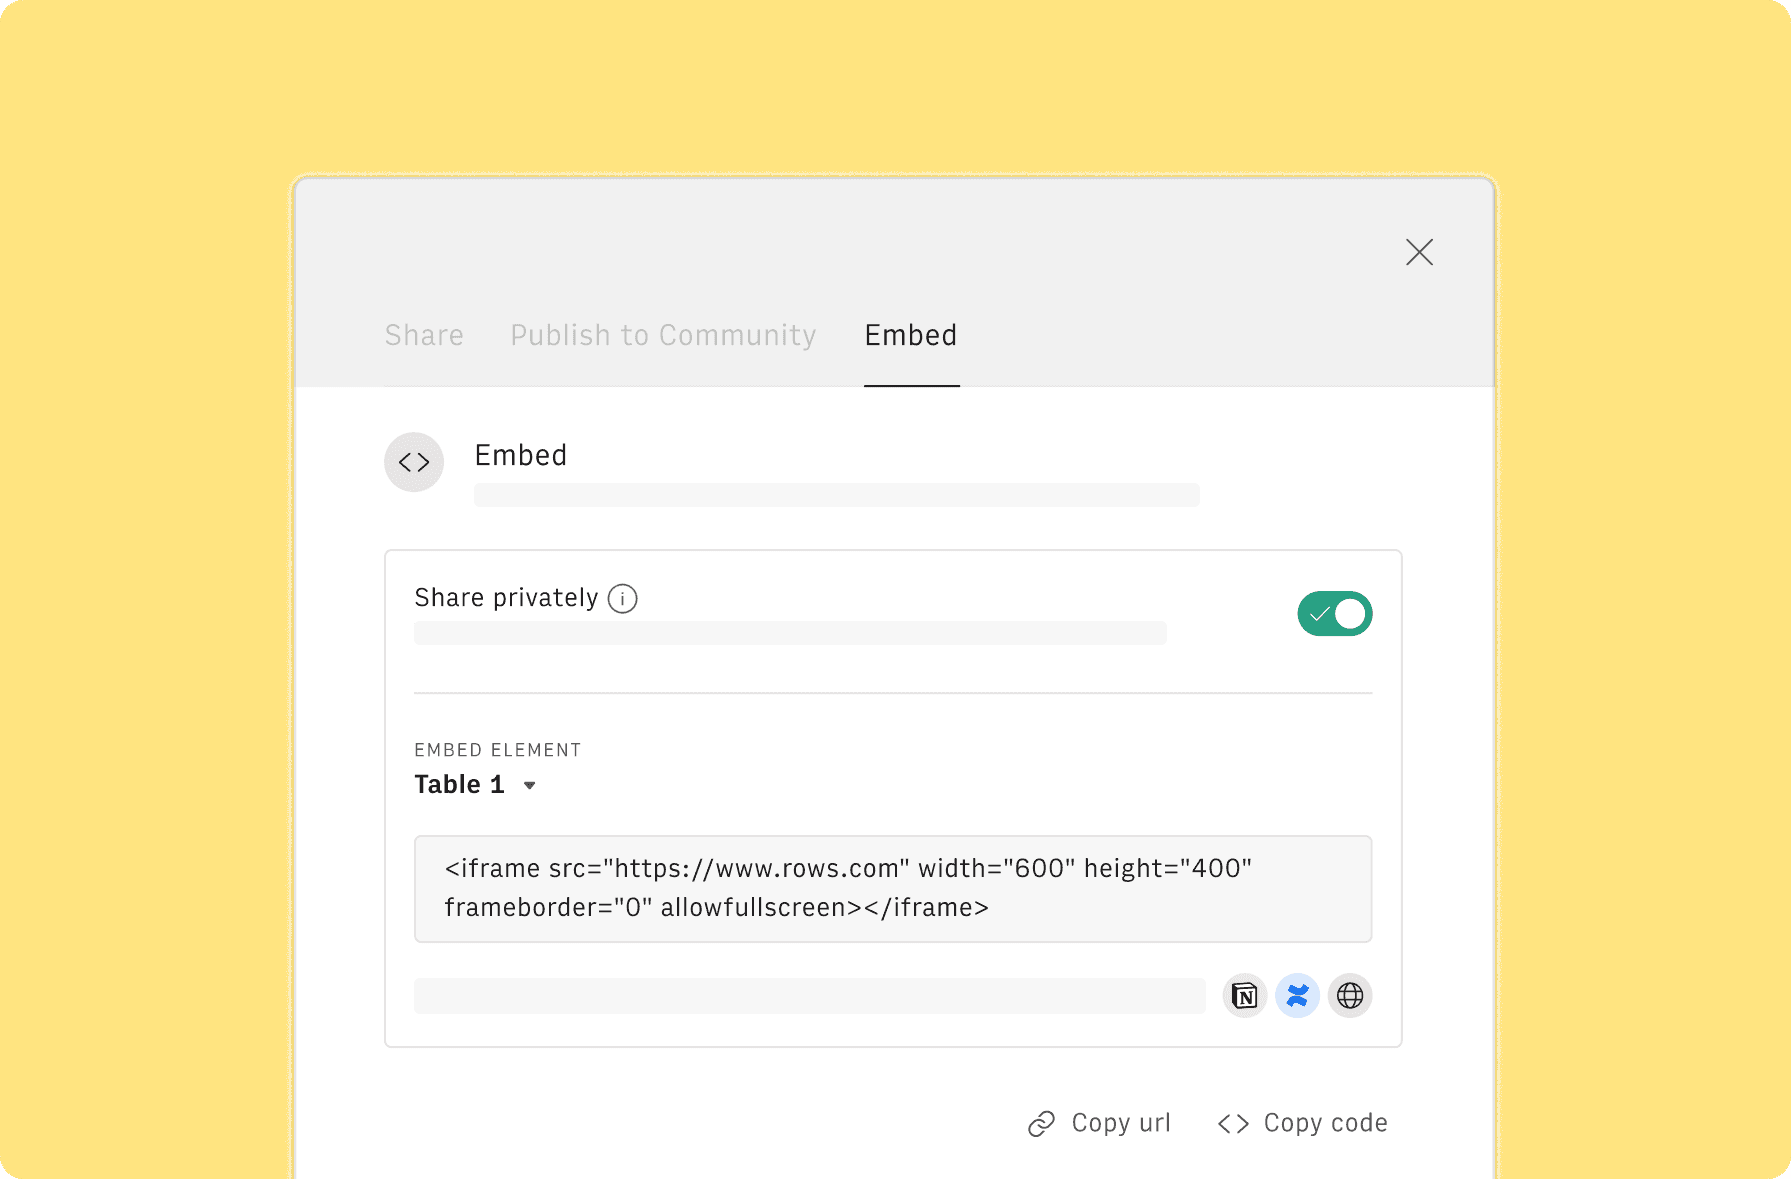
Click on the option menu to embed tables and chart on your Notion, Confluence or any other iframe-ready documents.
Questions and answers
Can I use Rows for free?
More than a Facebook Page Insights Report
Rows is the easiest way to import, transform and share data in a spreadsheet.
Signup for free

Import data from anywhere
Unleash your data: import from files, marketing tools, databases, APIs, and other 3rd-party connectors.
Know moreAnalyze with the power of AI
Unlock the power of AI on your data: ask the AI Analyst ✨ any question about your dataset and surface key insights, trends, and patterns.
Know moreCollaborate and Share
Seamlessly collaborate and share stunning reports with dynamic charts, embed options, and easy export features.
Know more

